
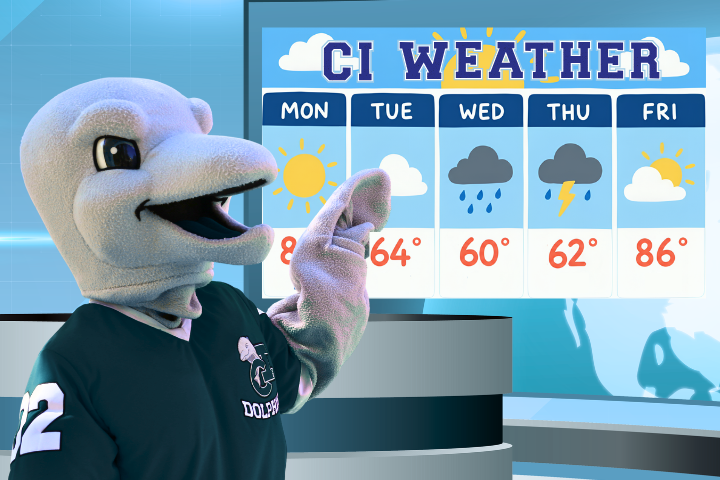
CI’s mascot, Ekho the Dolphin, forecasting the weather
Graphic by Dani Ramirez
By Sergio Gonzalez
As seasons change, the weather brings sudden heat waves, random rains and sometimes a mix of both. It is important for students to grasp what the weather forecast is trying to say, so they can be properly prepared days ahead. From what “feels like” means to humidity and the chance of rain, the following definitions can help CI students understand what they’re looking at when checking the weather.
Humidity
According to the National Weather Service (NWS), humidity is defined as the amount of water vapor in the air. Water vapor in the air slows the evaporation process, slowing the body’s natural cooling by sweating, which keeps the body warmer for longer.
For instance: Exiting a pool in low humidity will allow the water to dry quickly and cool the body. Exiting a pool in high humidity stops evaporation and keeps the body warmer.
The dewpoint
According to Apple Weather, the dew point is the estimated temperature at which dew or fog may form in relation to the humidity.
For instance: If the temperature is 64 degrees Fahrenheit and the dew point is 49 F, then that means if the weather were to reach 49 F, dew would form on grass and fog in the air.
Wind/wind speed and gusts
Wind, or wind speed, as explained by Guidewire’s Hazard Hub, a website dedicated to explaining the different kinds of natural risks to homes, is the consistent breeze that is felt from a given direction. These directions follow the cardinal points of North, South, East, West and variants.
Wind gusts are brief intervals of sudden and strong winds that exceed the wind speed by 12mph.
For instance: If the reported wind speeds are estimated to be at 6mph, the gusts may be reported to reach over 18mph.
Visibility
According to Apple Weather, visibility is how far into the distance is visible without fog or other natural blockage in the way. It is measured in feet or miles, depending on the distance. The amount of sunlight or the presence of unnatural obstructions (vehicles, buildings, etc.) is not accounted for. Visibility does not equal safety.
For instance: If the day’s visibility is recorded at 12 miles, an individual will be able to see 12 miles into the distance. If there is fog that hinders visibility at 9 miles, it will be recorded at 9 miles.

CI’s Bell Tower stands tall among the palm trees and clouds
Photo courtesy of ASI Marketing
Chance of rain percentage
Faiza Mohammed, a meteorology team member at The Weather Channel, explained that the daily percentage of rain is the average across an entire forecast zone. Meaning, a 60% chance of rain for someone on one side of the zone will vary in intensity and frequency compared to someone on the opposite side, or even a few blocks away, from the checked location. An effective way of reading this number is to read the percentage as the chance that it will rain in the exact location checked. When anticipating rain, checking the hourly breakdown instead of the daily average will be more effective when reading the percentages.
The heat index/ “feels like”
The heat index, per the NWS, is the temperature the body feels when considering the measured temperature combined with the humidity. The heat index may also be listed as “feels like” on certain weather applications. The estimated temperature may be 82 F, but with 65% humidity, the heat index would estimate the effect of 85 F instead. These calculations are done using a heat index chart. Being in the shade versus being in direct sunlight will also lead to different heat indexes.
The UV index
The World Health Organization described the UV index as the measurement of ultraviolet radiation produced by the sun’s rays. The higher the index, the more dangerous it is to be in direct sunlight, as ultraviolet (UV) rays are responsible for sunburn. UV is typically used as an indicator of when to be outside and tan or when to avoid the sun. The Skin Cancer Foundation recommends speaking to a dermatologist regarding what levels of UV rays your body can safely handle and what risk factors you may have.
Air quality
According to NASA, air quality determines the number of pollutants in the air that can be unsafe to inhale compared to the amount of safe breathable air. This measurement is done on a scale from 1-500; below 50 is determined to be safe for all individuals, 51-100 is considered moderate, 101-150 is considered unsafe for sensitive groups and 200-plus is considered unsafe for all individuals.
Atmospheric pressure
Atmospheric pressure is measured by barometer, which tracks changes in air pressure. As National Geographic stated, “a rapid drop in atmospheric pressure means that a low-pressure system is arriving. Low pressure usually means it will be cloudy, rainy, or windy…High-pressure areas usually create cool, dry air and clear skies.” Measuring atmospheric pressure helps predict the weather and how intense that weather will be. It can also help individuals avoid storms and inform sensitive groups who may be at risk in high or low-pressure environments.
The weather forecast can provide more information than just the day’s high and low temperatures. Understanding the definitions and measurements for humidity, wind speed, UV levels, air quality and more can help students decide what to wear, when to bring an umbrella or when to limit time outdoors. The next time you check the weather before heading to class, look beyond the temperature to better prepare yourself for what the day may bring.
